The Ishikawa diagram comes under many guises; cause and effect diagram or fishbone diagram, but it’s generally referring to the same problem solving tool. Dr Kaoru Ishikawa, an esteemed quality expert, gave his name to this simple, yet effective problem solving tool. In this Process Improvement Made Easy series, is the fishbone diagram explained in everyday language.
Why use a Cause and Effect Diagram?
If you want to discover the root cause of a problem and need a structured method to guide a team through a problem solving process, then the cause and effect diagram is for you. The tool allows a team to identify, explore and display in increasing detail, all of the possible causes of a problem, to eventually flush out the root cause(s) of the problem.
How do I use a Fishbone Diagram?
The process to follow is basically the same, regardless of industry or problem. It’s best to gather a team of people who have the right skills, knowledge and experience of the problem to collectively identify all the reasons why the problem may be occurring.
Top Tip – How Do You Eat An Elephant?
If your ideal team list is long, your problem is possibly too complex to solve in one hit, so consider breaking your problem up into more manageable (and edible!) chunks.
Okay, you’ve assembled your team – now you have to agree on a problem statement.
It’s Cookie Time!
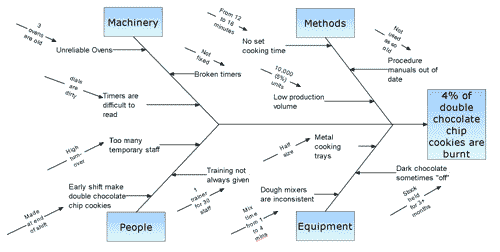
Let’s take the fictitious example of a Cookie making process.
The problem statement could be “Cookies are sometimes burnt or undercooked and have to be thrown away”. This might be enough detail, but it’s probably worth detailing “what”, “where”, “when” and “how much” to get a better understanding of the problem.
The problem statement could be refined as “4% of double chocolate chip cookies are burnt, and 0.5% are undercooked, and have to be thrown away”. At this point you might reason that it’s better to focus on the larger problem, and attempt to resolve the undercooking problem another day.
Top Tip – If It Moves, Measure It!
If you can’t quantify your problem, consider collecting some data before you go any further. Remember, you’re aiming to separate fact from opinion and identify the root cause of the problem.
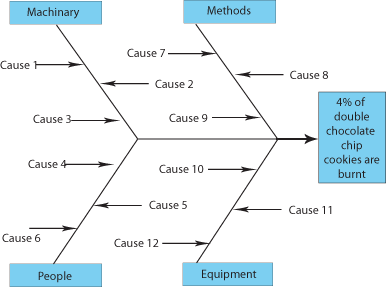
Draw the following fishbone diagram template up on a flip chart or large board, ensuring plenty of space.

Top Tip – The Writing’s On The Wall
In most cases, it will be most practical to write on paper, as this can be rolled up and brought to the next meeting.
You Shall Have a Fishy…
The problem statement is written at the “head” of the fish, with the 4 main causes of the problem coming of from the back bone. In manufacturing, the four main cause headings are usually “Machinery, People, Methods and Material” or in a service industry “Policy, Procedures, Plant and People”. Alternatively, you could list major steps in the process.
Top Tip – Sprats or Salmon?
There is no right way to do this – indeed you may require 6 bones. Just make the fishbone fit the problem, and your appetite!
Now it’s over to the team to come up with as many reasons why the problem is occurring.
Top Tip – Problems, problems!
Task the team with individually writing problem causes on post-it notes – one problem per note – for, say, 10 minutes. Then as a team, place each reason under the main cause headings, building up a detailed picture of why the problem is happening.
If you’re team are newly formed, consider using icebreakers or creative brainstorming activities to warm things up.
Top Tip – and the fish said “What is water?”
Remember that people are natural problem solvers and may have spent years doing creative work arounds, to get over routine problems. Indeed, these practices may be so ingrained they’re considered part of the job. If so, it’s your job to flush this out and solve the root cause of the problem by asking “why, why, why” for each reason.
Why, oh why, oh why!
You’ve completed a detailed fishbone diagram, and asked why 3 times for each reason. What next? There are probably a few causes that stand out as being the most likely root causes, and now it’s time to take action. It may be that further monitoring and data collection is required to establish a solid connection between the root cause and the effect, or you may have to rely on common sense and “gut feel” on where to start. Either way, you will have a clearer understanding of the problem and what’s causing it, and invest time and money on the right solution.

Whether you choose to call it the Fishbone, Cause and Effect or Ishikawa Diagram, it’s an effective, every day problem solving tool. Just keep it simple!